After a brief IRC session on ADSL and noise levels with some former colleagues, I decided to graph the line quality of my ADSL connection using cacti. This blog post will briefly explain how to graph any data that can be obtained from the zyxel zynos ras interface. The data will be graphed using cacti and this blog assumes that a working cacti installation already is running.
The task at hand can be split into two:
- Obtaining data from a zyxel device (a P-2602R in my case)
- Graphing the data in cacti
Obtaining data from a zyxel device
I attacked the first problem by doing an snmpwalk of the zyxel device. A normal consumer zyxel ADSL router like the P-2602R will export two MIB trees:
- The normal iso.3.6.1.2.1 tree
- The private iso.3.6.1.4.1.890 tree
This can be seen by doing a normal SNMP walk of the device:
iso.3.6.1.2.1.1.1.0 = STRING: "P-2602R-D1A"
iso.3.6.1.2.1.1.2.0 = OID: iso.3.6.1.4.1.890
A quick browse of the two MIB trees made it clear that not all values and parameters inside zynos was exported through SNMP. I had to find another way of obtaining the values that I needed.
Besides utilizing SNMP one, can make a telnet session to the zyxel device, whereby you end up at a RAS prompt. From there you can interface and control a zyxel device in great detail. You will probably need a password for this to work. Living in denmark, having telenor as my ISP, it is actually fairly easy as I, as a customer, has access to all the information needed, ie. ipaddress of the ADSL router, the password and port information. Using this information, I logged into the router
Trying 192.168.1.1…
Connected to 192.168.1.1.
Escape character is ‘^]’.
Password: **********
Copyright (c) 1994 – 2008 ZyXEL Communications Corp.
ras>
From there it was fairly easy to find the information that I was looking for
noise margin downstream: 22 db
output power upstream: 15 db
attenuation downstream: 12 db
Now I just needed be able to do this automatically. I used the unix tool expect in the form of the nice and easy to use Expect.pm perl module. After 15-20 minutes of coding, I ended up with a little script that will fetch whatever values from the zynos ras prompt your heart desires in one go. Example usage of the script (XXXXXXX denotes the secret password)
noise:22 attenuation:12
Graphing the data in cacti
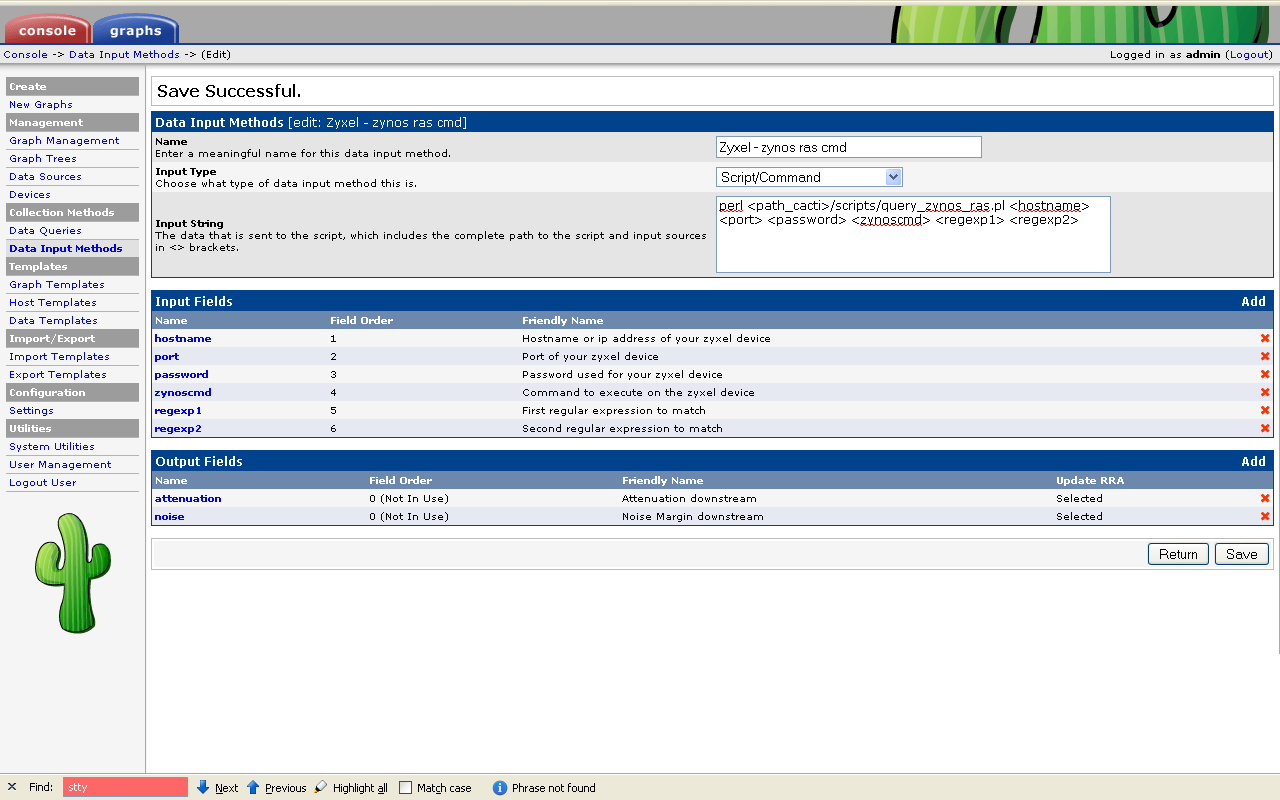
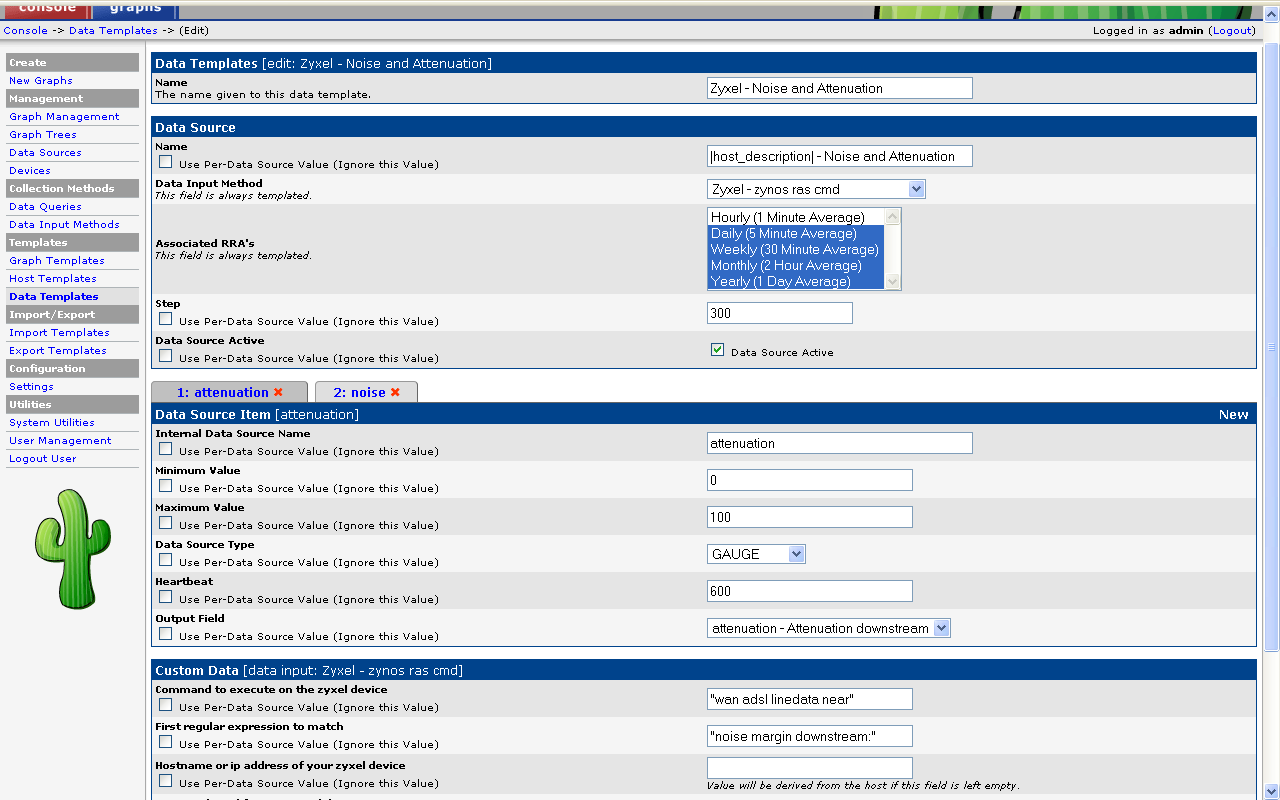
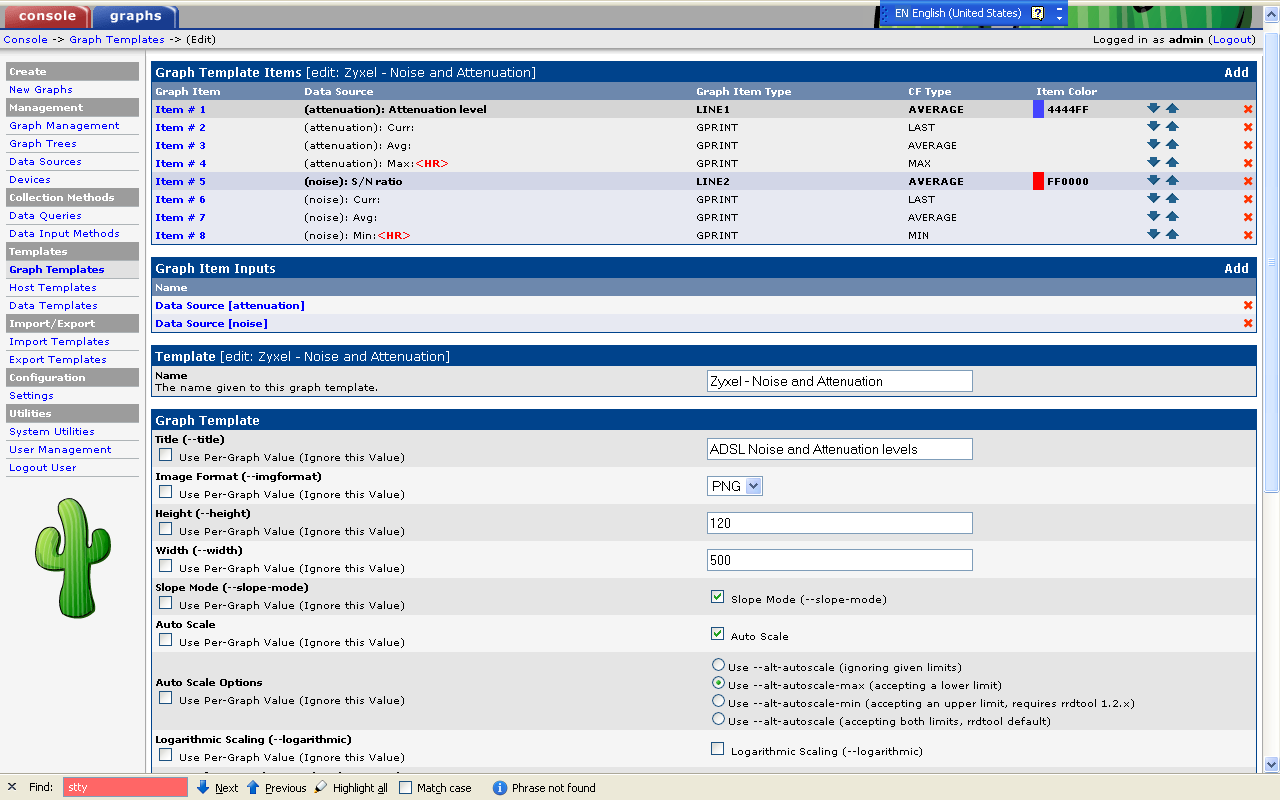
Now that the data collection had been scripted the data had to be graphed in cacti. This involved defining
- a data input method
- a data template and
- a graph template.
Quick and dirty screendumps on how to do it:
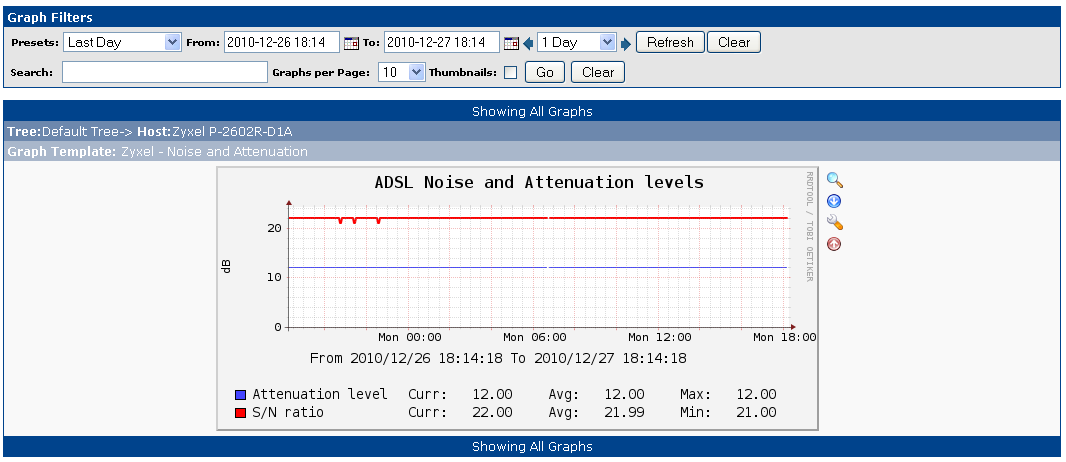
After a day or so, you get a graph like the following
From the graph I could see that my telephone line is very stable and that I should be able to get far better speeds if my current employer would pay telenor to provide it to me.


Leave a Reply
You must be logged in to post a comment.